
1838 to 1997, Brussels, Princeton, Los Alamos and Santa Cruz
One dial, then chaos
Pierre Francois Verhulst, Robert May, Mitchell Feigenbaum and a jar of flour beetles
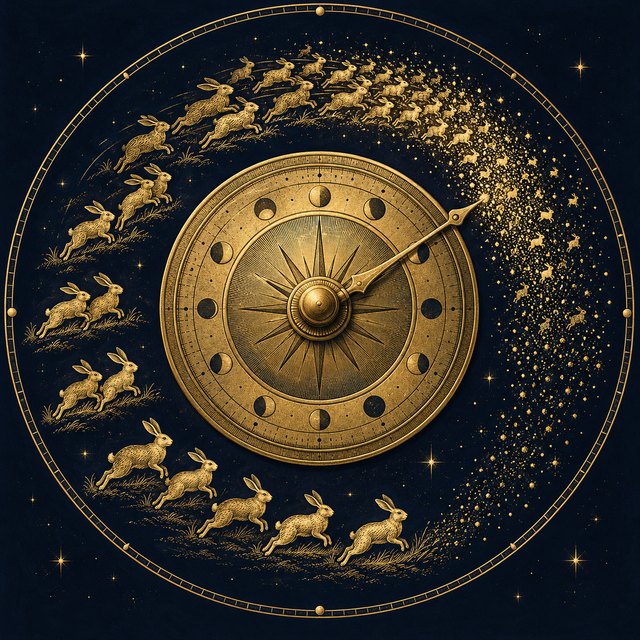
Rabbits in a field. Next year's count is this year's count, times how fast they breed, times how much room is left. That is the whole equation, one line, and it is the same line for yeast in a flask, deer on an island and people in a country. Turn the breeding rate up and the rabbits settle, then alternate between a big year and a small year, then cycle through four, then eight, and then there is no pattern at all. The dial is below. The place where the pattern breaks has a number in it that turns up in dripping taps and boiling fluids, and the figure it draws is the Mandelbrot set seen from the side.
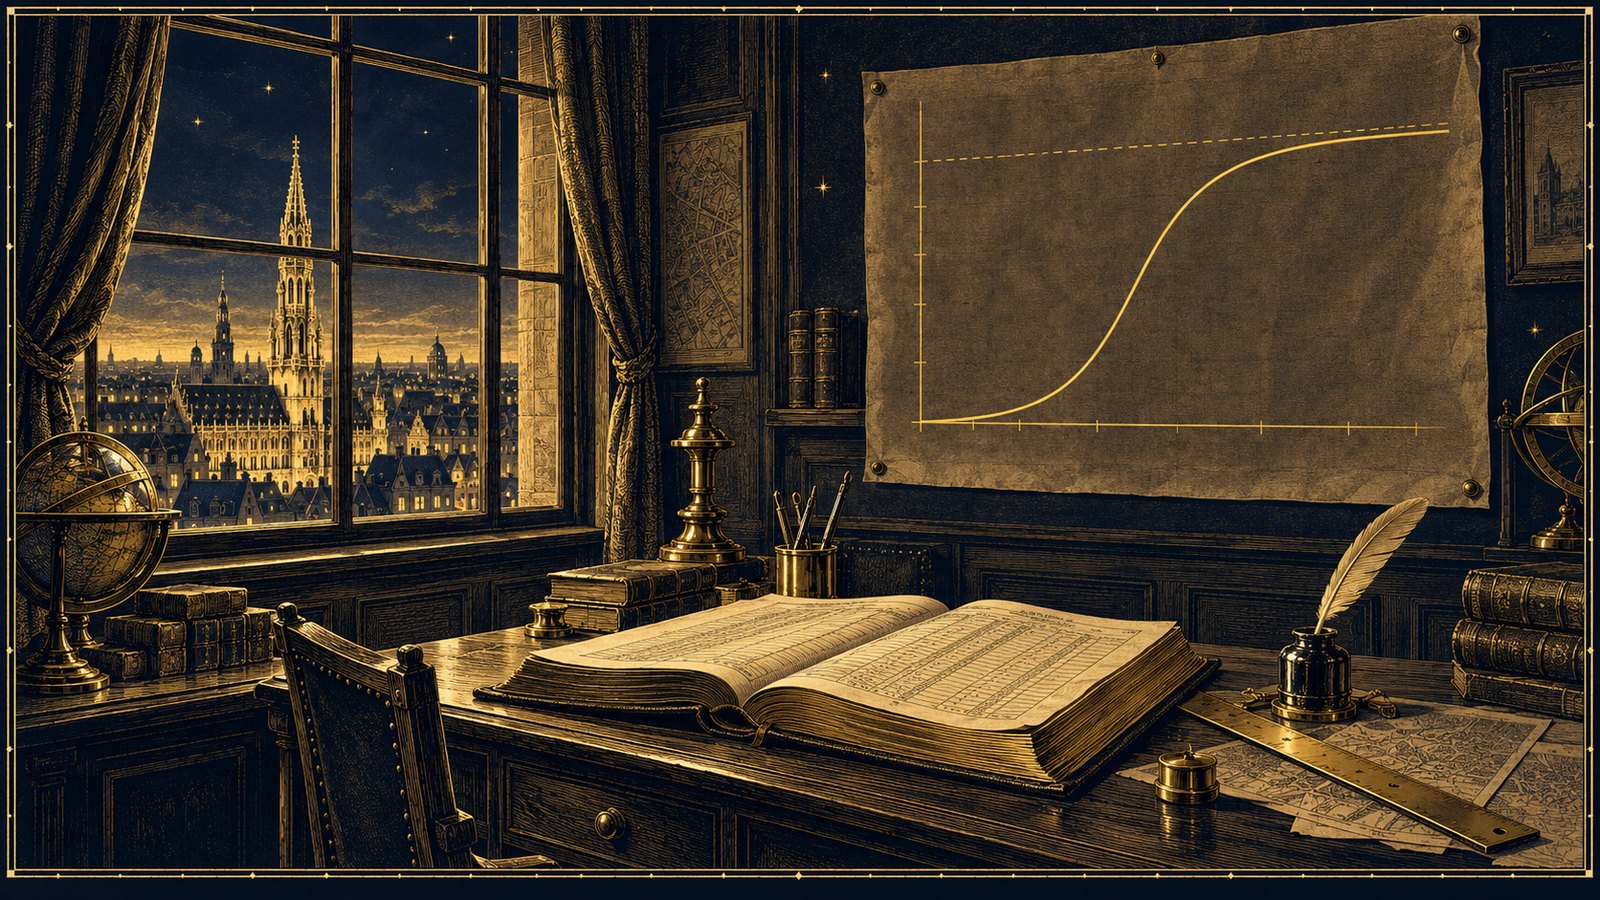
In 1838 a mathematician in Brussels named Pierre Francois Verhulst read Malthus and did what Malthus had not. Malthus had said populations grow by multiplying, each generation a fixed fraction larger than the last, and that food does not, so people must outrun their bread. Verhulst asked what happens to the growth when the room runs out, and wrote the correction as one term: the rate at which a population grows falls off in proportion to how full the place already is. The curve that comes out starts slow, rises steeply, and bends over to a ceiling it approaches and never crosses, an S lying on its side. He called it the logistic curve in a second paper in 1845 and fitted it to the census returns of Belgium, France and England. The fits were good. The ceilings were not; more on that at the end. The curve was forgotten for seventy-five years, rediscovered in 1920 by two men at Johns Hopkins who fitted it to the American census and thought they had invented it, and it has been the first equation in every population biology course since. Yeast in a flask follow it. Sheep in Tasmania followed it. Bacteria on a dish follow it until the dish is full.
The dial
Written for one year at a time, the equation is short enough to say aloud. Next year's population is this year's population, times the breeding rate, times the fraction of the room still empty. Call the population a fraction of the most the field can hold, so it runs from nought to one. If the field is nearly empty the last term is nearly one and the rabbits multiply freely. If the field is nearly full the last term is nearly nought and almost nobody is born. In between it balances, and for a breeding rate of two or two and a half the rabbits climb to a level and stay there, year after year, exactly as Verhulst's curve says.
In 1976 Robert May, an Australian physicist who had moved into biology at Princeton, published a paper in Nature about what happens when you keep turning the breeding rate up. Past three, the rabbits stop settling. They overshoot the level one year and undershoot it the next, a big year then a small year, for ever: the population has a period of two. Turn the dial a little further and the big years split into a bigger and a less big, the small years likewise, and the cycle has a period of four. Then eight. Then sixteen. The doublings come faster and faster, and at a breeding rate of about 3.57 they have all happened, and beyond it the yearly count never repeats. It is not random, since every year follows from the last by the same one line of arithmetic, and it is not predictable either, because two fields that start one rabbit apart are on different paths within a few years. May called it chaos, and his paper ended with a plea that every student be shown the equation early, so that they would know that simple rules do not promise simple behaviour.
Doubling
Mitchell Feigenbaum, at Los Alamos in 1975, took the places on the dial where the doublings happen and measured the gaps between them on a programmable pocket calculator, which was slow enough that he had time to notice something while it worked. Each gap was smaller than the one before by the same factor: 4.669, and then more decimals, the same number every time. He then tried a completely different equation, a sine curve instead of a parabola, and got 4.669 again. The number did not belong to the rabbits. It belonged to the act of doubling itself, and any system that goes to chaos by doubling its period, whatever it is made of, approaches the edge at that one rate. The claim was so strange that the journals turned the paper down for two years.
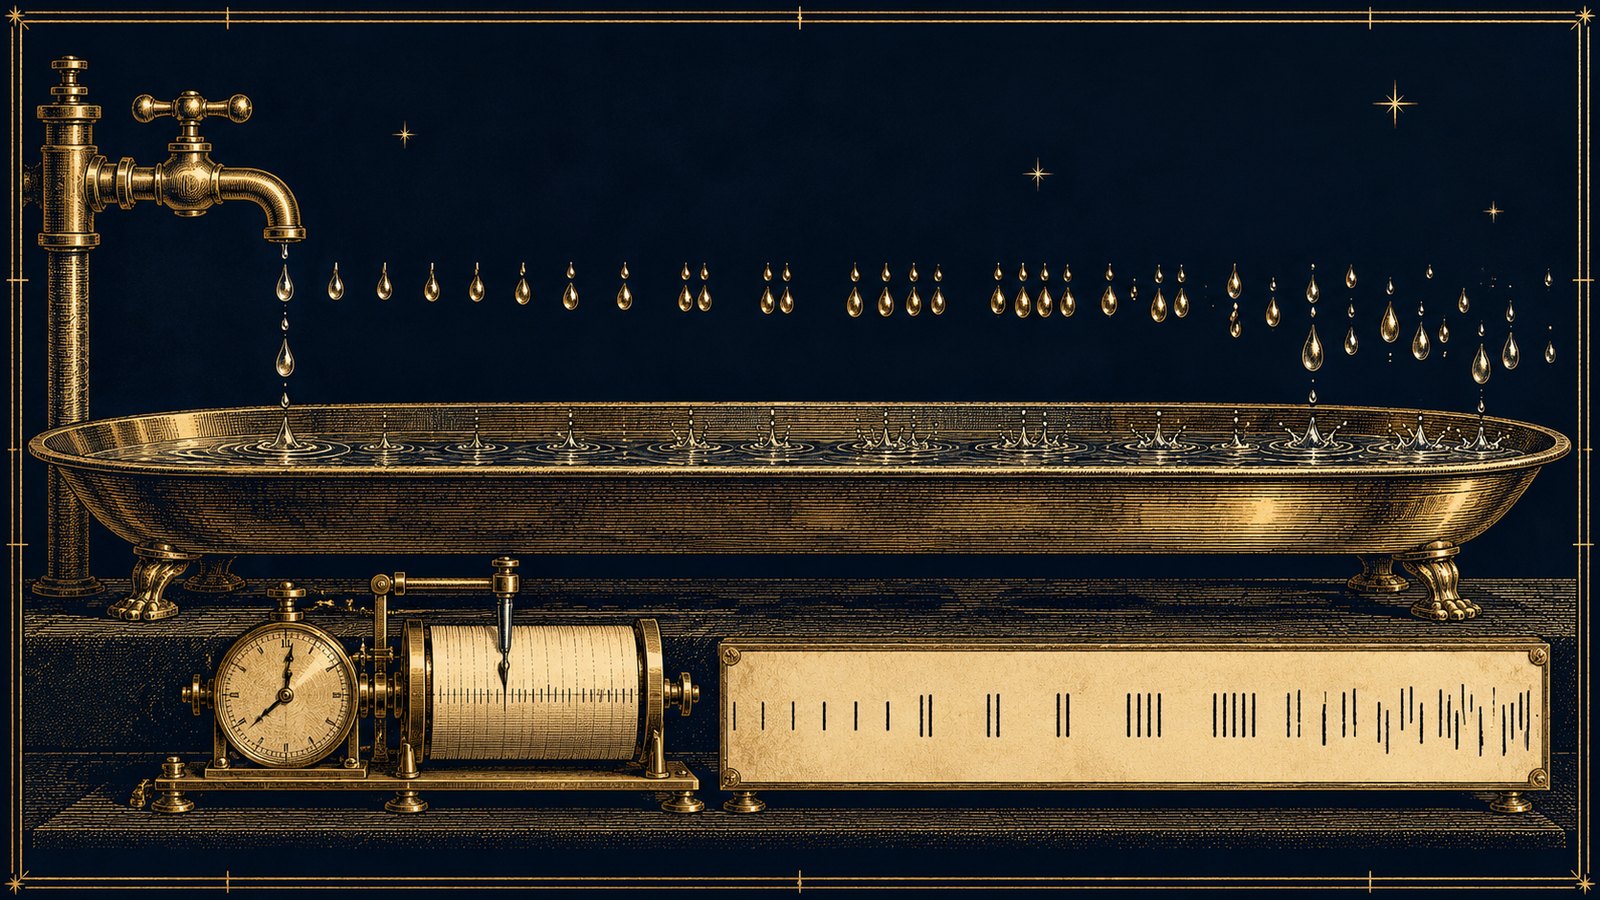
Then the number turned up in the world. Albert Libchaber in Paris heated a cell of liquid helium a few millimetres across from below and watched the rolls of convection begin to wobble, then wobble with a period of two, then four, with the gaps between the doublings shrinking by Feigenbaum's factor; he did it again in mercury. A graduate student in Santa Cruz named Robert Shaw put a microphone under a dripping tap and timed the drops: evenly spaced at a slow flow, then in pairs, then in fours, then with no pattern at all, the same road to chaos in plain water from a kitchen fitting. Hearts going into fibrillation, lasers, electrical circuits, the drive on a loudspeaker: the doublings and the number were in all of them. A quantity that was found on a calculator in a study of imaginary rabbits is a constant of nature, in the same sense that pi is.
The set
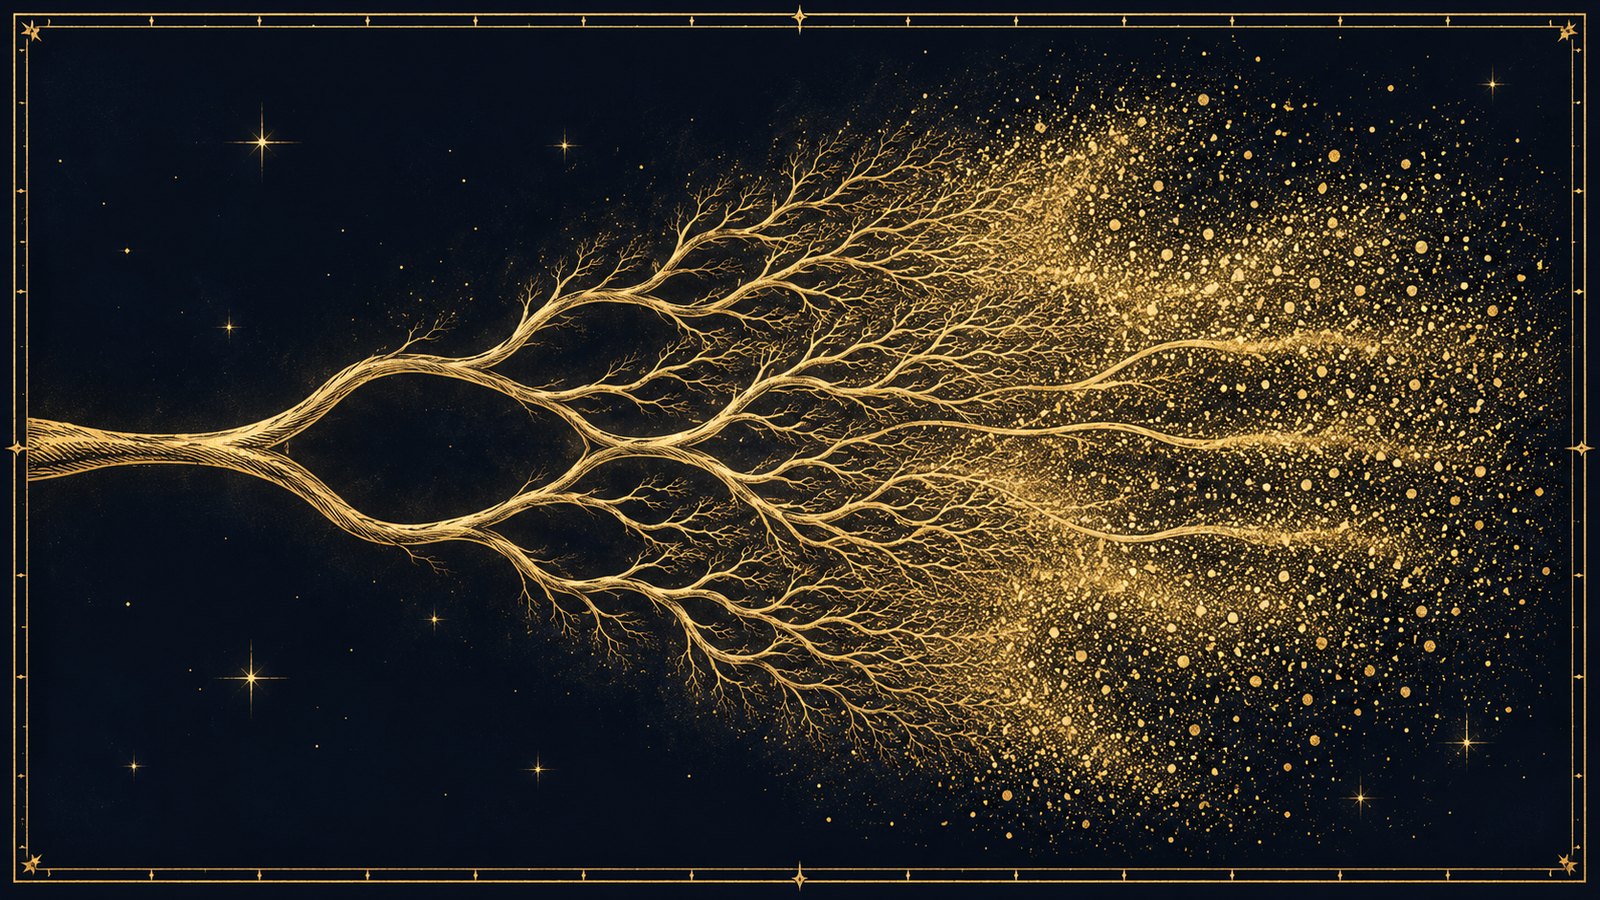
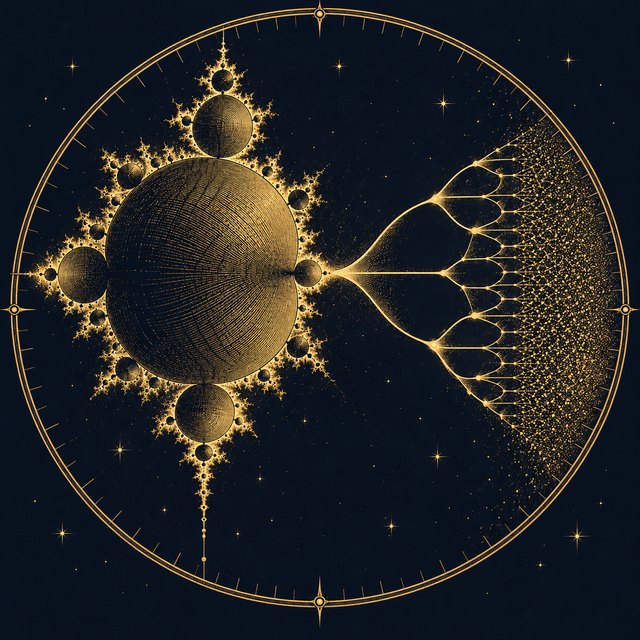
There is one more thing in the diagram, and it is the reason this page sits on the shelf next to the coastline of everything. Draw the tree of doublings with the dial along the bottom and the yearly populations stacked above each setting, so that a settled population is one line, a period of two is two lines, and chaos is a band of dust. Inside the dust there are clear windows where the branches come back, and the widest of them, near a breeding rate of 3.83, has exactly three lines in it. Now take the Mandelbrot set, the figure from the coastline page, and lay it on its side along the same axis. The big cardioid covers exactly the range of the dial where the rabbits settle. The round bulb attached to it covers the range where they alternate between two values. The next bulb is the period of four, and the needle that runs out to the point of the set is the chaos, with a small copy of the whole set sitting at the exact place where the window of three opens. The two figures are the same object. The Mandelbrot set is made by the same rule as the rabbits, multiply and add, carried out on numbers with two parts instead of one, and the rabbit equation is the slice of it that runs along the real line. Benoit Mandelbrot did not know this when he drew the set in 1980, and neither did May when he turned the dial in 1976. The pictures were put together afterward.
The instrument
One dial, the breeding rate, from one half to four. The dial mode shows sixty years of rabbits at the setting you choose, the tree mode shows every setting at once with your setting marked, and the set mode lays the Mandelbrot set under the tree so you can see the bulbs line up with the forks. Drag the dial slowly through three, through 3.45, through 3.57, and stop at 3.83 for the window of three. Tap the disc in the tree or the set to jump the dial to that place.

The honest part
Verhulst's curve fits the past and does not foretell the future. His ceiling for Belgium was about six and a half million people, later raised toward nine; Belgium passed eleven million some time ago and is still growing. The two Americans who rediscovered the curve in 1920 put the ceiling for the United States at 197 million, which the country passed in the 1960s on its way to 340. The curve is a true picture of a population filling a fixed room, and a country is not a fixed room: the ceiling moves as farming, trade and medicine move it, and a curve fitted to one century has no way to know what the next one will invent.
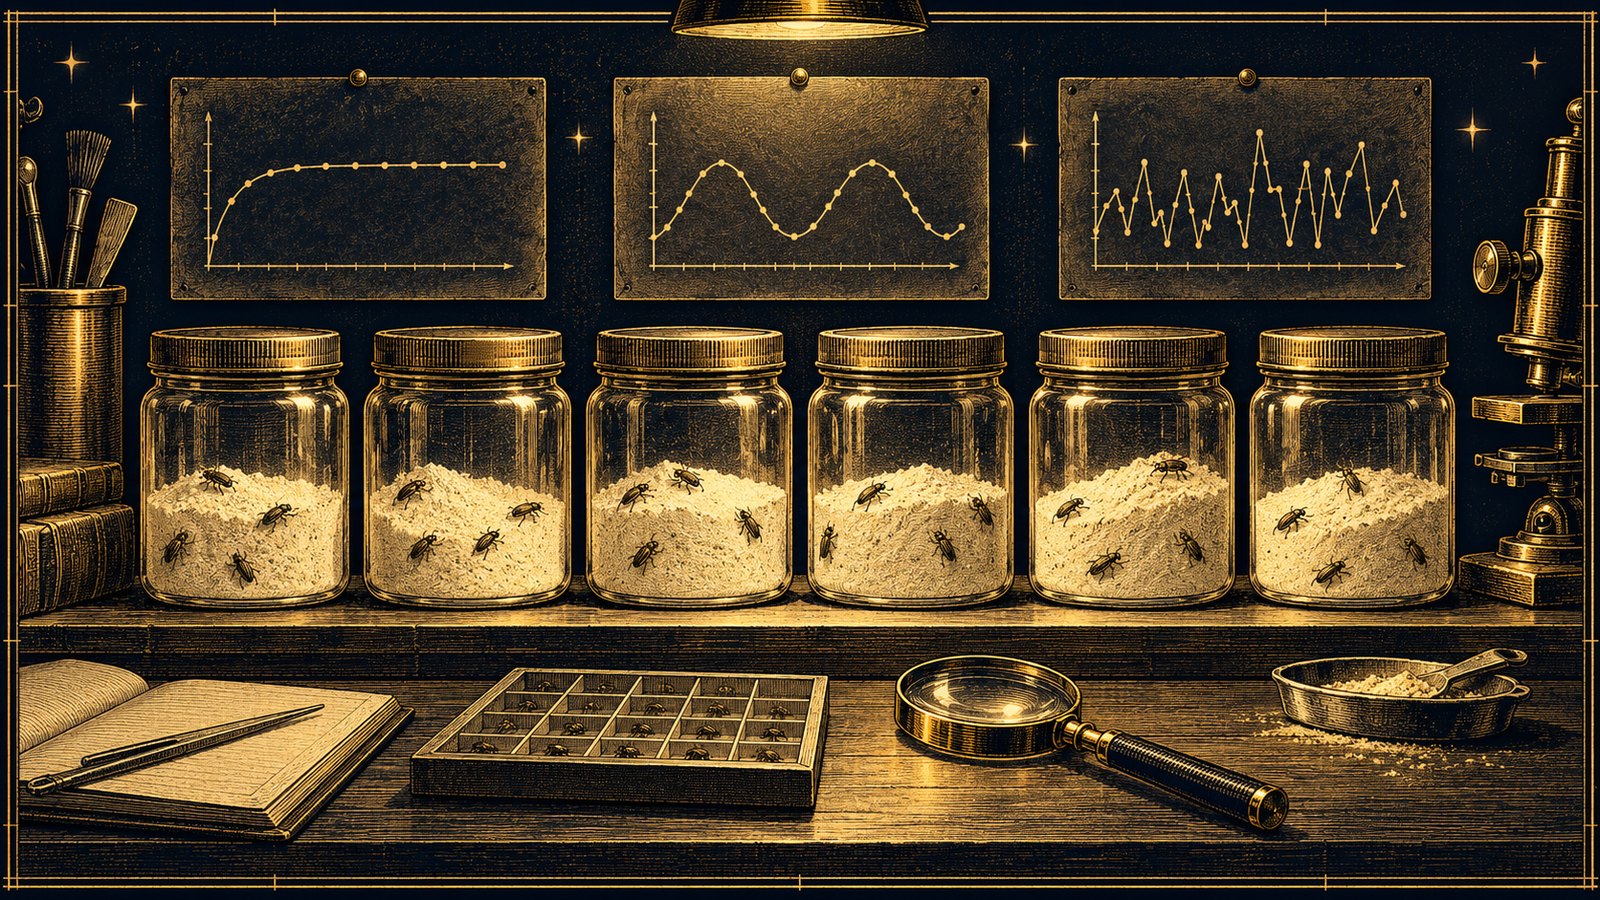
The rabbits in the equation also breed once a year, all together, and nothing eats them. Real populations are noisier and more tangled than that, and when ecologists went looking for chaos in the wild after 1976 they mostly found weather, measurement error and predators instead. The clean cases are in the laboratory. In 1997 a team in Arizona and Rhode Island raised flour beetles in jars for years, set the adult death rate in each jar by hand, and watched the counts go from steady to cycling to chaotic exactly where their equation said they would, the first population that was shown to be chaotic rather than merely messy. The famous wild case is not this equation at all: the Hudson's Bay Company's fur ledgers, which run from 1821, show the Canada lynx and the snowshoe hare rising and crashing together about every ten years, with the lynx a year or two behind the hare. That is a chase between two populations, written down by Lotka and Volterra in the 1920s, and its cycle is a cycle, not chaos.

What stands is the thing May asked students to be shown. The equation on this page has no noise in it, no weather, no predators and no luck, and it still cannot be predicted past a few years once the dial is turned far enough. Determinism and predictability had been treated as the same thing since Laplace, and this is the simplest known place where they come apart. The number in the gaps is real, the taps and the helium obey it, and the picture it draws, if you stand it on end, is the one on the shelf next door.